
SS SPDR S&P 500 ETF TRUST-US
SPYNYSE ARCATrading Snapshot
- Day Range
- $769.25 – $773.35
- 52-Week Range
- $629.28 – $781.62
- Volume (shares)
- 30,033,924
- Avg Volume (shares)
- —
- Shares Outstanding
- 1.06B
- Next Earnings
- —
Fundamentals Snapshot
- Annual Revenue
- —
- Last Q Revenue
- —
- P/E Ratio
- —
- P/S Ratio
- —
- EPS (TTM)
- —
- Dividend Yield
- —
SS SPDR S&P 500 ETF TRUST-US
SPYFinancial history unavailable.
 StockOtter · stockotter.space
About SS SPDR S&P 500 ETF TRUST-US
SPY is the best-recognized and oldest US listed ETF and typically tops rankings for largest AUM and greatest trading volume. The fund tracks the massively popular US index, the S&P 500. Few realize that S&P's index committee chooses 500 securities to represent the US large-cap space - not necessarily the 500 largest by market cap, which can lead to some omissions of single names. Still, the index offers outstanding exposure to the US large-cap space. It's important to note, SPY is a unit investment trust, an older but entirely viable structure. As a UIT, SPY must fully replicate its index (it probably would anyway) and forgo the small risk and reward of securities lending. It also can`t reinvest portfolio dividends between distributions, the resulting cash drag will slightly hurt performance in up markets and help in downtrends. SPY is a favored vanilla trading vehicle.
Otter Score Breakdown
How it's scoredFive components, each rated 1–5★ and equally weighted (20%), averaged to a 0–100 score:💎 Quality — gross margin🚀 Growth — revenue YoY⚖️ Valuation — P/S ratio⚡ Momentum — 30-day price change💧 Dilution — 1-yr share issuance (buybacks score higher)Insufficient data for all five components.
Latest News & Updates
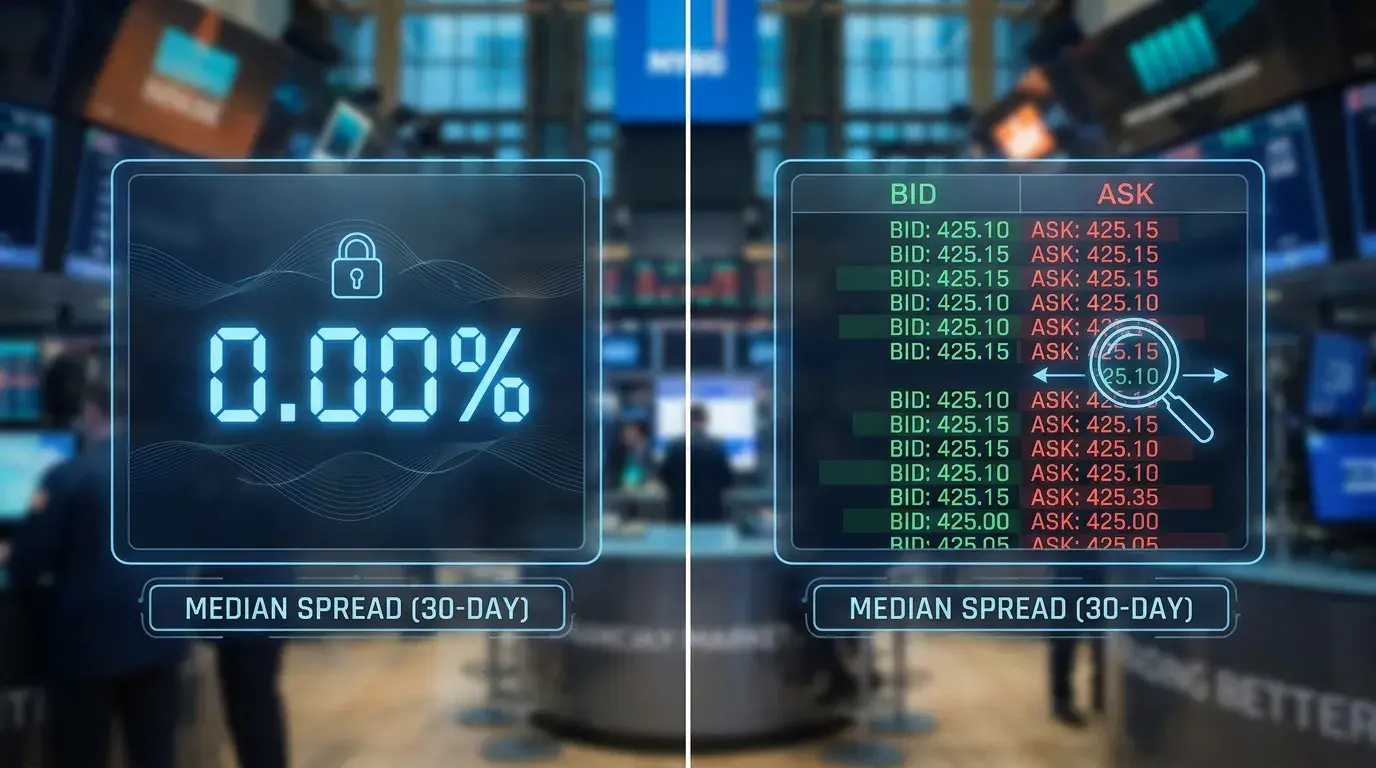
Your ETF’s Spread Looks Like Zero. Here’s What That Number Doesn’t Tell You
That 0.00% bid-ask spread on your ETF looks like free trading, but the number is calculated in a way that quietly ignores the moments most likely to cost you money.

American Households Own More of the Stock Market Than at Any Time Since the Dot-Com Era
Household stock ownership just hit a level not seen since the late 1990s, and the last time Americans held this much of the market, a historic crash followed. Here is what the Federal Reserve's latest data reveal about c

S&P500 and Dow Jones: Fed Policy Statement Sets Up Next Move for Indices
The Fed decision, Warsh's inflation outlook and major tech earnings could drive the next move in the S&P 500, Nasdaq and Dow Jones.

S&P 500 to 9,000? 5 Stocks to Buy Now
The S&P 500 could surge to 9,000 by early 2027, and Key Advisors Wealth Management CEO Eddie Ghabour warns this is not the time to take chips off the table. As tech sets up for a November “coiled spring,” he breaks down
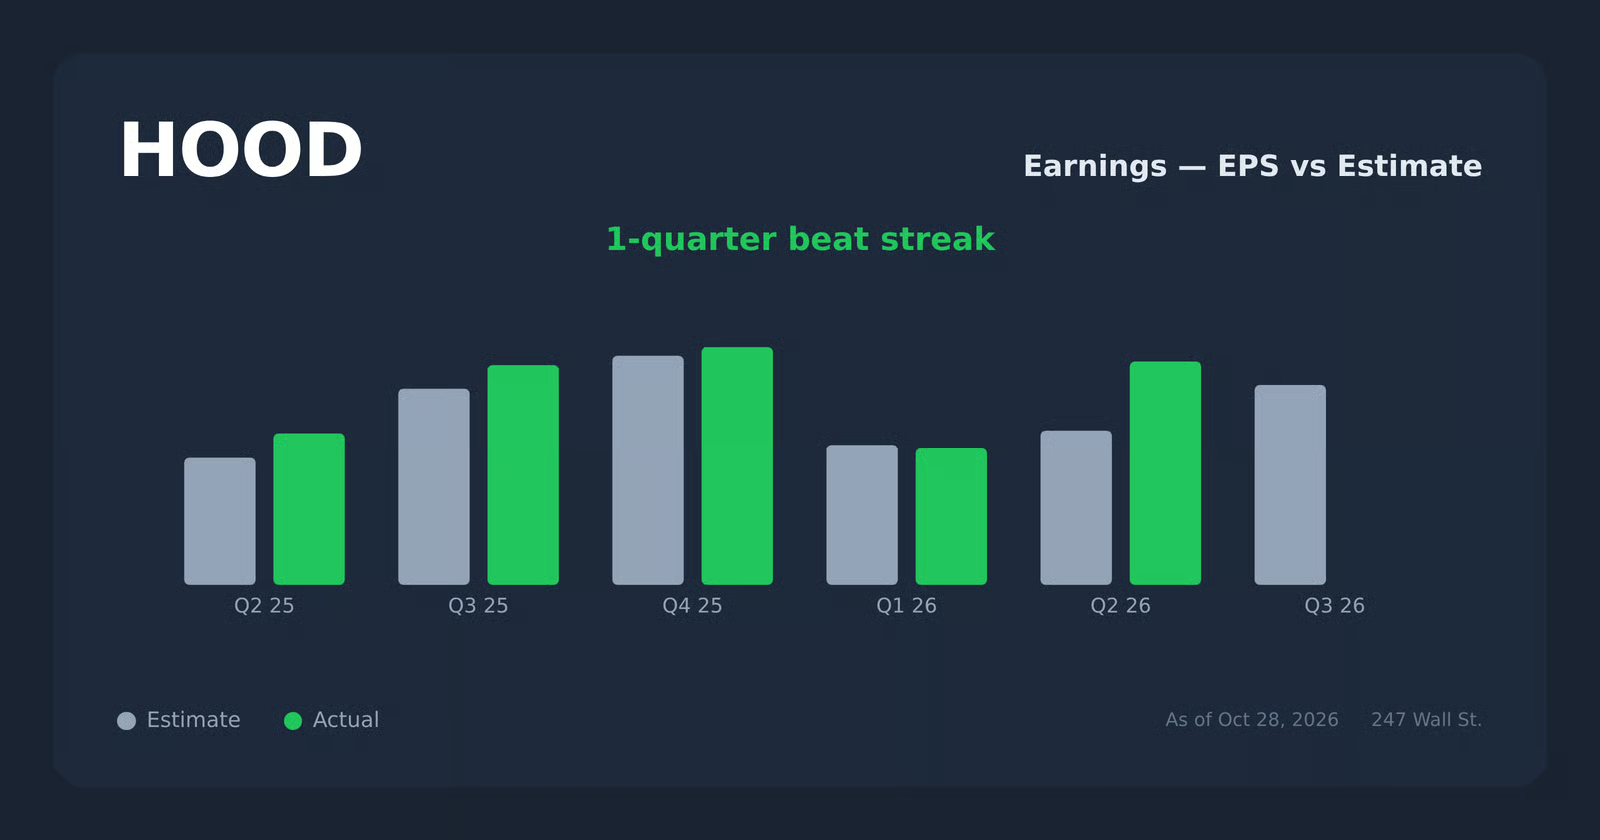
Wall Street’s Borrowing Binge Is Slowing, and BofA Says That Can Signal a Top
Bank of America's top technical strategist flagged a pattern that preceded every major market peak since 2000, and it is showing up again right now in the data investors use least.

The S&P 500 Is Approaching a Valuation Not Seen Since the Peak of the Dot-Com Bubble, and History Suggests a Crash Could Follow
The S&P 500's valuation is approaching a historic level, leaving it vulnerable to a sharp sell-off. Geopolitical conflicts, rising interest rates, and turbulence in the artificial intelligence industry could derail the c