SPACE EXPLORATION TECHN-CL A
SPCXNASDAQTrading Snapshot
- Day Range
- $142.13 – $147.57
- 52-Week Range
- $104.83 – $225.64
- Volume (shares)
- 97,570,461
- Avg Volume (shares)
- —
- Shares Outstanding
- 13.58B
- Next Earnings
- 2027-02-25
Fundamentals Snapshot
- Annual Revenue
- $18.67B
- Last Q Revenue
- $14.57B
- P/E Ratio
- —
- P/S Ratio
- 73.1x
- EPS (TTM)
- $-0.04
- Dividend Yield
- —
SPACE EXPLORATION TECHN-CL A
SPCX StockOtter · stockotter.space
About SPACE EXPLORATION TECHN-CL A
Space Exploration Technologies Corp. The company is headquartered in Starbase, Texas.
Otter Score Breakdown
How it's scoredFive components, each rated 1–5★ and equally weighted (20%), averaged to a 0–100 score:💎 Quality — gross margin🚀 Growth — revenue YoY⚖️ Valuation — P/S ratio⚡ Momentum — 30-day price change💧 Dilution — 1-yr share issuance (buybacks score higher)Insufficient data for all five components.
Analyst Ratings
ⓘLatest News & Updates

Prediction: This Will Be SpaceX's Stock Price in 3 Years
SpaceX's best divisions have nothing to do with its rocket launch business. Its AI business is seeing an explosion of growth.

Jim Cramer says these tech giants can weather market turbulence
CNBC's Jim Cramer said Wednesday that a select group of technology stocks are less vulnerable to economic pressures. He identified Alphabet, Amazon, Apple, Meta Platforms, Microsoft, Nvidia, Tesla, SpaceX, Anthropic and

Not Space. Not Starlink. Here's My Top Reason to Buy SpaceX Stock.
SpaceX's super intelligence division just revealed an incredible quarter of growth. SpaceX is starting to become profitable.

Elon Musk Says Neoclouds Face a "Guppy Level" Death. IREN Is Down 64% From Its High. Is He Talking About This Stock?
SpaceX's CEO expects the tightening debt markets to choke unprofitable neocloud companies.

SpaceX's Starlink Just Added 1.6 Million Customers. But That's Not the Best News
Starlink's average revenue per user grew sequentially during the third quarter. This business has attractive opportunities as SpaceX continues to scale it.
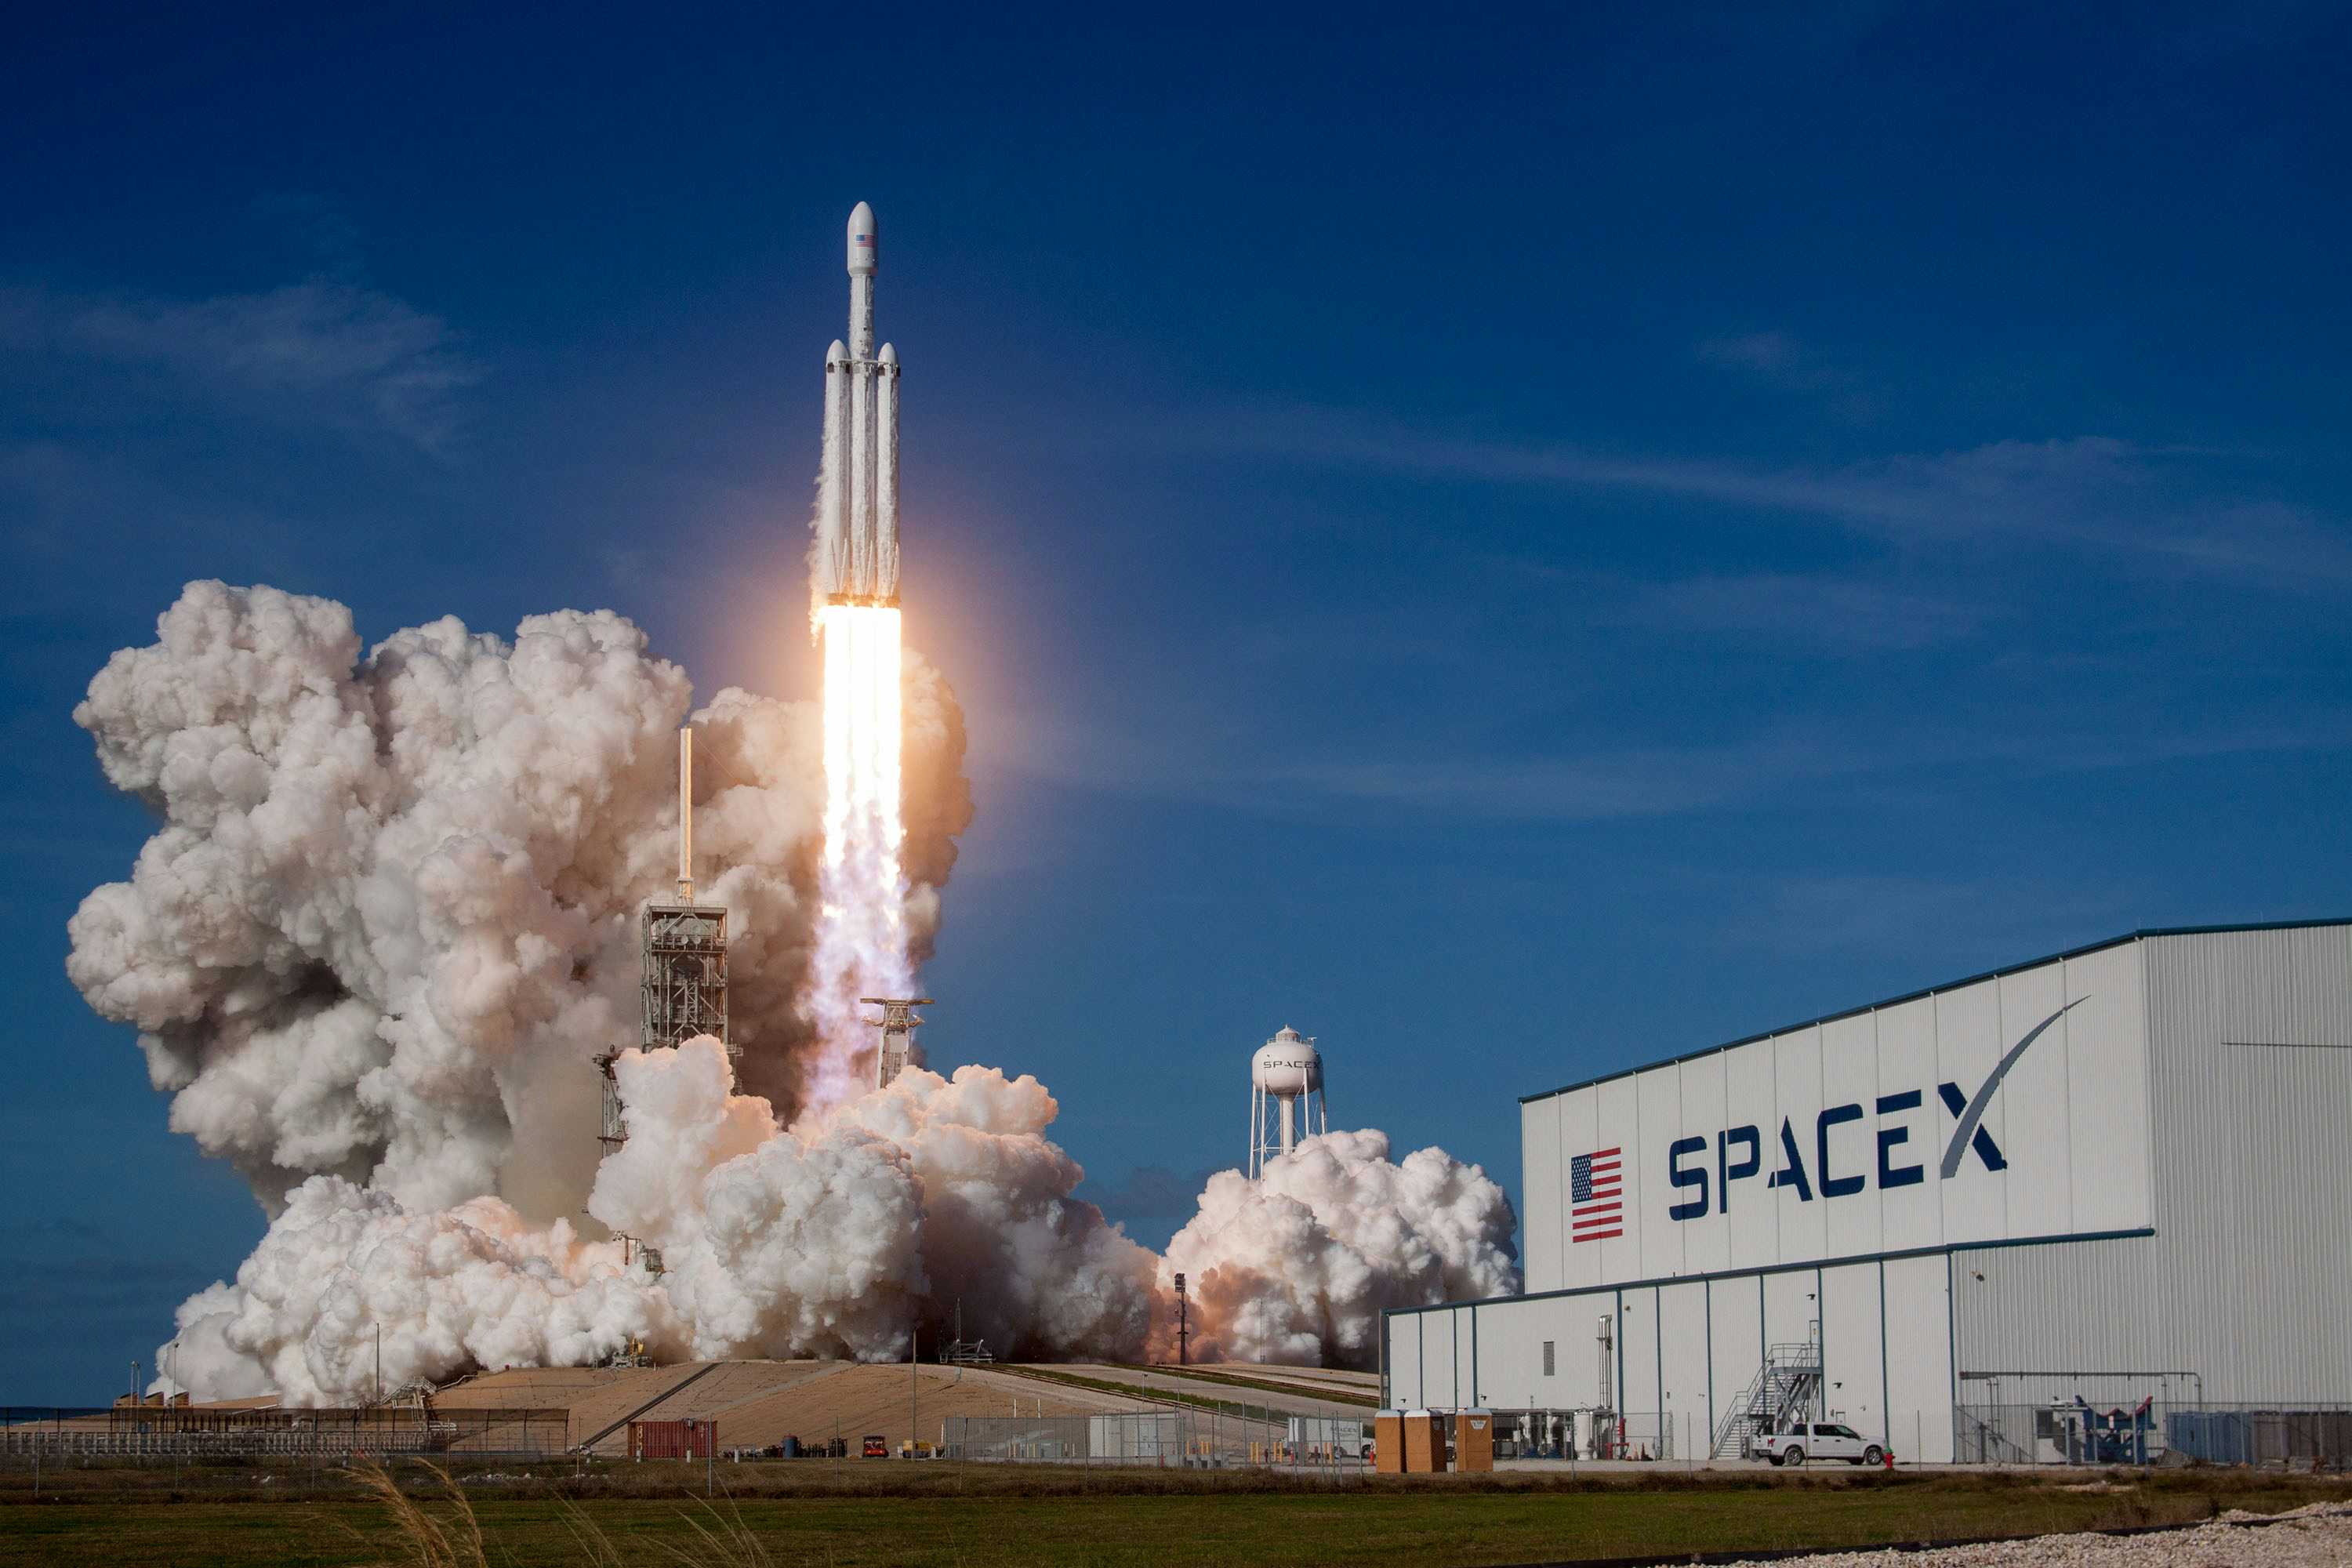
SpaceX's $100 Billion Louisiana Project Hit With Tax Deal Lawsuit
Space Exploration Technologies Corp. (SPCX, Financials), the aerospace and satellite company, is facing a legal challenge over the tax arrangement supporting it