
INTERGROUP CORP
INTGNASDAQTrading Snapshot
- Day Range
- $34.11 – $38.10
- 52-Week Range
- $24.96 – $52.00
- Volume (shares)
- 19,601
- Avg Volume (shares)
- —
- Shares Outstanding
- 2.1M
- Next Earnings
- —
Fundamentals Snapshot
- Annual Revenue
- $74M
- Last Q Revenue
- $18M
- P/E Ratio
- 46.1
- P/S Ratio
- 1.0x
- EPS (TTM)
- $0.74
- Dividend Yield
- —
- Dilution (1yr)
- +0.0%
INTERGROUP CORP
INTG StockOtter · stockotter.space
About INTERGROUP CORP
The InterGroup Corporation, established in Los Angeles, California, in 1965, conducts its operations through three main segments: Hotel Operations, Real Estate Operations, and Investment Transactions. Within its Hotel Operations division, the company oversees the Hilton San Francisco Financial District, a prominent hotel located in San Francisco, California. This facility features 544 guest rooms and luxury suites, approximately 22,000 square feet of meeting space, a grand ballroom, a five-level underground parking garage, a pedestrian skybridge, and a dedicated Chinese cultural center. As of June 30, 2021, the company's Real Estate Operations portfolio encompassed 16 apartment complexes, 3 strategically held single-family residences, and 1 commercial real estate asset situated across the United States. It also owned roughly two undeveloped acres in Maui, Hawaii. The Investment Transactions segment actively engages in a diverse range of income-generating financial instruments. These include corporate debt and equity securities, shares in publicly traded investment funds, mortgage-backed securities, and holdings in Real Estate Investment Trusts (REITs) and other firms predominantly focused on real estate investments.
Otter Score Breakdown
How it's scoredFive components, each rated 1–5★ and equally weighted (20%), averaged to a 0–100 score:💎 Quality — gross margin🚀 Growth — revenue YoY⚖️ Valuation — P/S ratio⚡ Momentum — 30-day price change💧 Dilution — 1-yr share issuance (buybacks score higher)Insufficient data for all five components.
Latest News & Updates
Reviewing Intergroup (NASDAQ:INTG) and Noodles & Company (NASDAQ:NDLS)
Intergroup (NASDAQ: INTG - Get Free Report) and Noodles and Company (NASDAQ: NDLS - Get Free Report) are both small-cap consumer discretionary companies, but which is the superior investment? We will contrast the two com
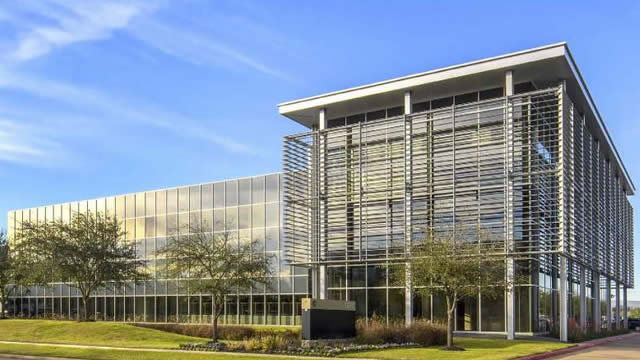
INTG Falls 16% in Three Months: Should You Buy the Dip or Wait?
InterGroup's strong hotel revenue growth and improving real estate income face challenges from mounting operating costs, substantial debt and tight liquidity.
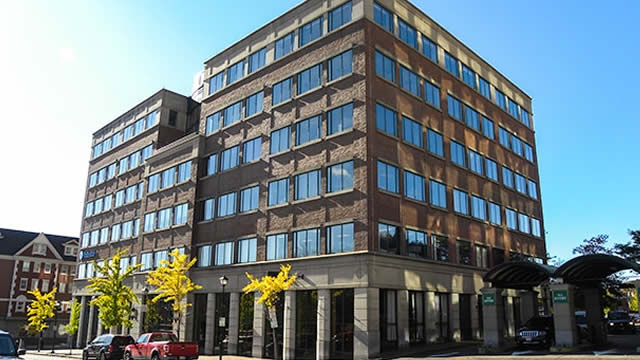
InterGroup Posts Fiscal 2026 Earnings on Strong Hotel Results
INTG reports net income of 71 cents per share in fiscal 2026 on the back of stronger hotel operations, improved occupancy and better investment results.

The InterGroup Corporation Reports Fiscal 2026 Results; Returns to Net Income as Hotel Operating Performance Strengthens Year-Over-Year
Los Angeles, California, Sept. 29, 2026 (GLOBE NEWSWIRE) -- The InterGroup Corporation (NASDAQ: INTG) (the “Company” or “InterGroup”) financial results for the fiscal year ended June 30, 2026. InterGroup operates in thre