
SAUL CENTERS INC
BFSNYSETrading Snapshot
- Day Range
- $29.00 – $29.60
- 52-Week Range
- $28.69 – $38.42
- Volume (shares)
- 8,692
- Avg Volume (shares)
- —
- Shares Outstanding
- 24.7M
- Next Earnings
- 2026-11-05
Fundamentals Snapshot
- Annual Revenue
- $292M
- Last Q Revenue
- $77M
- P/E Ratio
- 20.7
- P/S Ratio
- 2.4x
- EPS (TTM)
- $1.43
- Dividend Yield
- 9.50%
- Dilution (1yr)
- −0.3%
SAUL CENTERS INC
BFS StockOtter · stockotter.space
About SAUL CENTERS INC
Saul Centers, Inc. (BFS) is a self-managed and self-administered equity REIT, headquartered in Bethesda, Maryland. The company actively operates and oversees a real estate portfolio of 60 properties. This portfolio encompasses 50 community and neighborhood shopping centers, as well as seven mixed-use developments, which together provide approximately 9.8 million square feet of leasable area. Additionally, it includes three properties designated as land or for future development. A significant portion of the company's operational revenue, around 85%, originates from its properties located within the metropolitan Washington, DC, and Baltimore regions.
Otter Score Breakdown
How it's scoredFive components, each rated 1–5★ and equally weighted (20%), averaged to a 0–100 score:💎 Quality — gross margin🚀 Growth — revenue YoY⚖️ Valuation — P/S ratio⚡ Momentum — 30-day price change💧 Dilution — 1-yr share issuance (buybacks score higher)Analyst Ratings
ⓘLatest News & Updates

Surge Announces Start of 2026/27 Drill Program at Nevada North Lithium Project in Support of the Bankable Feasibility Study (BFS)
West Vancouver, British Columbia--(Newsfile Corp. - September 22, 2026) - Surge Battery Metals Inc. (TSXV: NILI) (OTCQX: NILIF) (FSE: DJ5) (the "Company" or "Surge") is pleased to announce that drilling has begun on the
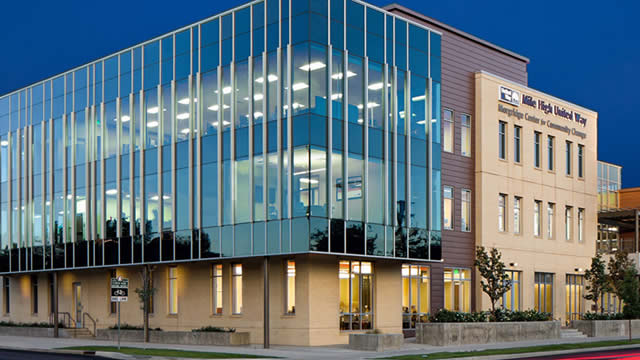
Saul Centers: Attractive Even Amidst Higher Interest Rates (Upgrade)
Saul Centers is upgraded to 'buy' after a 20% pullback, offering value for income-oriented investors. Higher interest rates and a levered balance sheet have pressured BFS, but most debt is fixed-rate or hedged, moderatin

Saul Centers Declares Quarterly Dividends
BETHESDA, Md., Sept. 17, 2026 /PRNewswire/ -- Saul Centers, Inc. (NYSE: BFS) has declared a quarterly dividend of $0.59 per share on its common stock, to be paid on October 30, 2026, to holders of record on October 15, 2

Saul Centers, Inc. Reports Second Quarter 2026 Earnings
BETHESDA, Md., Aug. 6, 2026 /PRNewswire/ -- Saul Centers, Inc. (NYSE: BFS) (the "Company"), an equity real estate investment trust ("REIT"), announced operating results for the quarter ended June 30, 2026 ("2026 Quarter"