

VENTAS INC
VTRNYSETrading Snapshot
- Day Range
- $86.50 – $87.49
- 52-Week Range
- $66.38 – $101.60
- Volume
- $2.87B
- Avg Volume
- $2.99B
- Shares Outstanding
- 513.0M
- Next Earnings
- Oct 16, 2026
Fundamentals Snapshot
- Annual Revenue
- $6.10B
- Last Q Revenue
- $1.41B
- P/E Ratio
- 182.3
- P/S Ratio
- 7.4x
- EPS (TTM)
- $0.55
- Dividend Yield
- 1.94%
Why Investors Own VTR
- ✓High-growth profile — revenue up -5.2% YoY with expanding US Equity exposure.
- ✓Healthy economics — 65% gross margin and 14% free-cash-flow margin.
- ✓New products and segments could unlock additional revenue streams.
Execution delays, intensifying competition, and valuation compression if growth decelerates.
Financial Trends
About VENTAS INC
A company profile for VENTAS INC isn’t available yet — check back soon.
Otter Score Breakdown
ⓘAnalyst Ratings
ⓘLatest News & Updates

Tuesday's session: top gainers and losers in the S&P500 index
Stay updated with the movements of the S&P500 index one hour before the close of the markets on Tuesday. Discover which stocks are leading as top gainers and losers in today's session.
Discover which S&P500 stocks are making waves on Tuesday.
Stay informed about the performance of the S&P500 index in the middle of the day on Tuesday. Uncover the top gainers and losers in today's session for valuable insights.

Tuesday's session: gap up and gap down stock in the S&P500 index
Looking for opportunities in today's market? Check out the S&P500 gap up and gap down stocks on Tuesday and stay ahead of the market trends.

Are Wall Street Analysts Bullish on Ventas Stock?
As Ventas has outperformed the broader market over the past 52 weeks, Wall Street analysts maintain a highly optimistic outlook about the stock’s prospects.
Ventas (VTR) Q2 2026 Earnings Call Transcript
Senior housing portfolio surges with 16% NOI growth and 300 basis points occupancy gains.
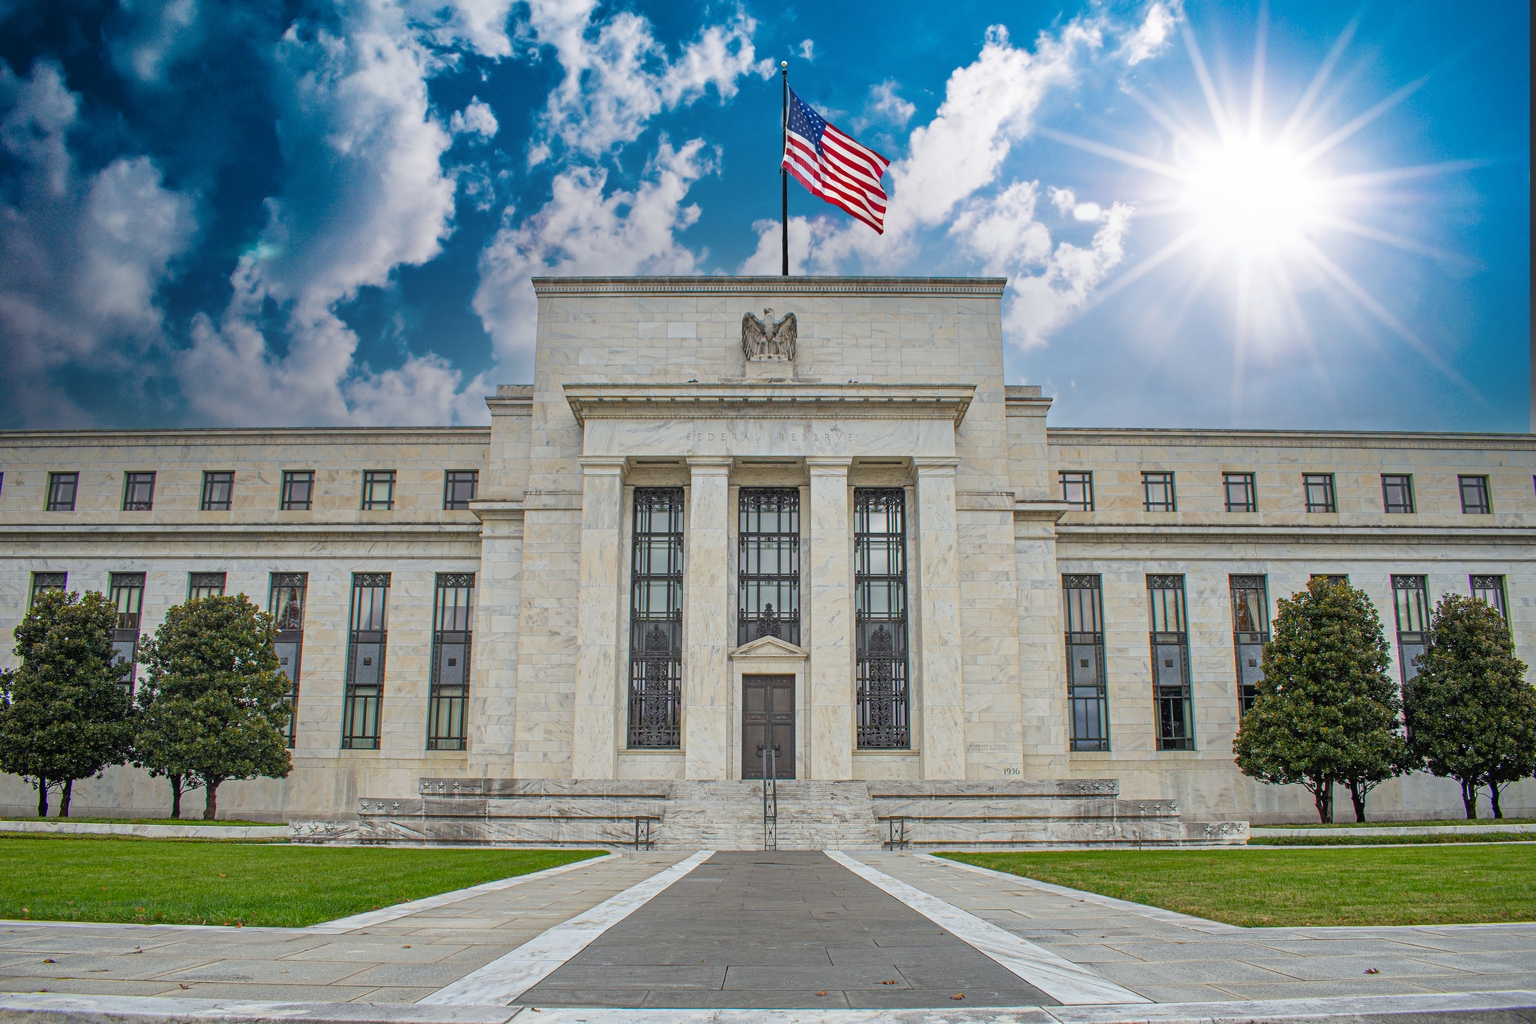
A Hawkish Hold, A Steeper Curve
REITs lagged as rising long-term yields outweighed exceptionally strong earnings. Click here to read more about the real estate market here.