
VALMONT INDUSTRIES
VMINYSETrading Snapshot
- Day Range
- $429.29 – $441.62
- 52-Week Range
- $378.02 – $585.71
- Volume (shares)
- 205,177
- Avg Volume (shares)
- —
- Shares Outstanding
- 19.3M
- Next Earnings
- 2027-02-15
Fundamentals Snapshot
- Annual Revenue
- $4.10B
- Last Q Revenue
- $1.10B
- P/E Ratio
- 17.2
- P/S Ratio
- 2.0x
- EPS (TTM)
- $25.14
- Dividend Yield
- 0.65%
- Dilution (1yr)
- −2.2%
VALMONT INDUSTRIES
VMI StockOtter · stockotter.space
About VALMONT INDUSTRIES
Valmont Industries, Inc. is a global enterprise specializing in engineered products, conducting operations across the United States, Australia, Brazil, Denmark, and other international markets. The company's business is organized into two primary divisions: Infrastructure and Agriculture. Within its Infrastructure segment, Valmont designs, produces, and distributes a wide array of engineered metal, steel, wood, aluminum, and composite structures, including poles, towers, and components. These are deployed in critical areas such as lighting, traffic control, and wireless communication networks. The segment also delivers specialized access systems, integrated structural solutions for smart urban environments, and highway safety products. Furthermore, it provides robust steel and concrete pole structures essential for utility transmission, power distribution, substations, and renewable energy generation facilities, complemented by inspection services. To ensure the durability of metal products, Valmont offers protective services like hot-dipped galvanizing, anodizing, and powder coating. The Agriculture segment focuses on advanced water management technologies and solutions tailored for precision farming. It manufactures and supplies mechanical irrigation equipment, along with associated parts and support services, primarily serving the agricultural industry under its well-known Valley brand. Additionally, this segment produces tubular products for various industrial clients. Valmont's extensive customer base includes municipalities and government agencies, manufacturers of commercial lighting fixtures, construction contractors, telecommunications and utility providers, large agricultural operations, and the broader manufacturing sector. Established in 1946, the company maintains its headquarters in Omaha, Nebraska.
Otter Score Breakdown
How it's scoredFive components, each rated 1–5★ and equally weighted (20%), averaged to a 0–100 score:💎 Quality — gross margin🚀 Growth — revenue YoY⚖️ Valuation — P/S ratio⚡ Momentum — 30-day price change💧 Dilution — 1-yr share issuance (buybacks score higher)Analyst Ratings
ⓘLatest News & Updates
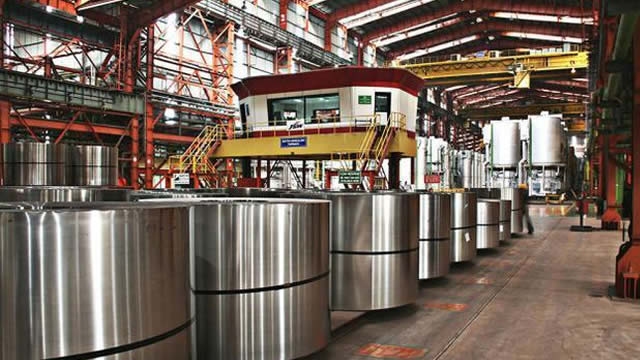
VMI Q3 Earnings Beat Estimates on Utility Strength, Sales Miss
Valmont's Q3 2026 earnings beat estimates on strong Utility and Coatings sales, despite a revenue miss and Agriculture weakness, prompting a higher EPS outlook.
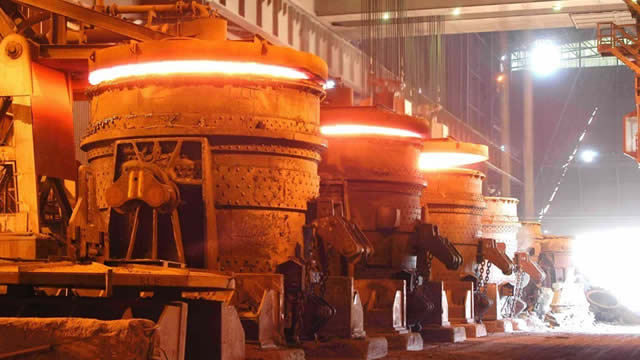
Valmont (VMI) Loses 8.4% in 4 Weeks, Here's Why a Trend Reversal May be Around the Corner
Valmont (VMI) is technically in oversold territory now, so the heavy selling pressure might have exhausted. This along with strong agreement among Wall Street analysts in raising earnings estimates could lead to a trend

Riverwater Partners Sustainable Value Strategy Q3 2026 Portfolio Update
The Sustainable Value Strategy trailed its benchmark, the Russell 2500 Value Index, in the third quarter. New positions include Lineage, Birkenstock, Matador Resources, KBR and ICON. InterDigital, Stevanato Group and Exe

Valmont Board Declares Quarterly Dividend
OMAHA, Neb.--(BUSINESS WIRE)--Valmont® Industries, Inc. (NYSE: VMI), a global leader that provides products and solutions to support vital infrastructure and advance agricultural productivity, today announced that its Bo

Valmont Industries, Inc. (VMI) Q3 2026 Earnings Call Transcript
Valmont Industries, Inc. (VMI) Q3 2026 Earnings Call Transcript
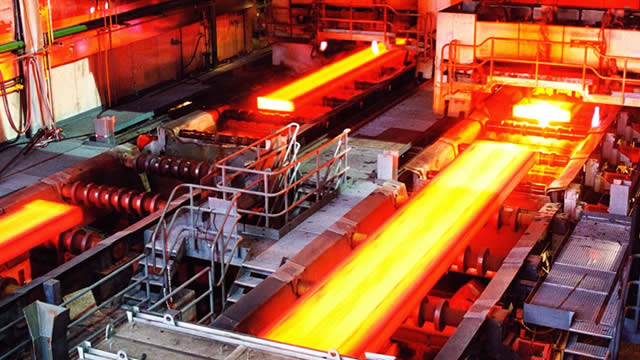
Valmont Industries Q3 Earnings Call Highlights
Valmont Industries NYSE: VMI reported higher third-quarter sales, operating profit and earnings, led by growth in its North American utility and coatings businesses, while management raised its full-year adjusted earning