

TWILIO INC - A
TWLONYSETrading Snapshot
- Day Range
- $562.69 – $575.45
- 52-Week Range
- $91.84 – $255.57
- Volume
- $4.89B
- Avg Volume
- $4.08B
- Shares Outstanding
- 151.8M
- Next Earnings
- Sep 24, 2026
Fundamentals Snapshot
- Annual Revenue
- $5.25B
- Last Q Revenue
- $1.18B
- P/E Ratio
- 369.0
- P/S Ratio
- 7.2x
- EPS (TTM)
- $0.64
- Dividend Yield
- —
Why Investors Own TWLO
- ✓High-growth profile — revenue up +16.7% YoY with expanding US Equity exposure.
- ✓Healthy economics — 60% gross margin and 27% free-cash-flow margin.
- ✓New products and segments could unlock additional revenue streams.
Execution delays, intensifying competition, and valuation compression if growth decelerates.
Financial Trends
About TWILIO INC - A
A company profile for TWILIO INC - A isn’t available yet — check back soon.
Otter Score Breakdown
ⓘAnalyst Ratings
ⓘLatest News & Updates

Twilio, Transocean, Blackstone And More On CNBC’s ‘Final Trades’
Jim Lebenthal recommended Transocean, citing better-than-expected earnings. Other stock picks include Blackstone and Twilio.
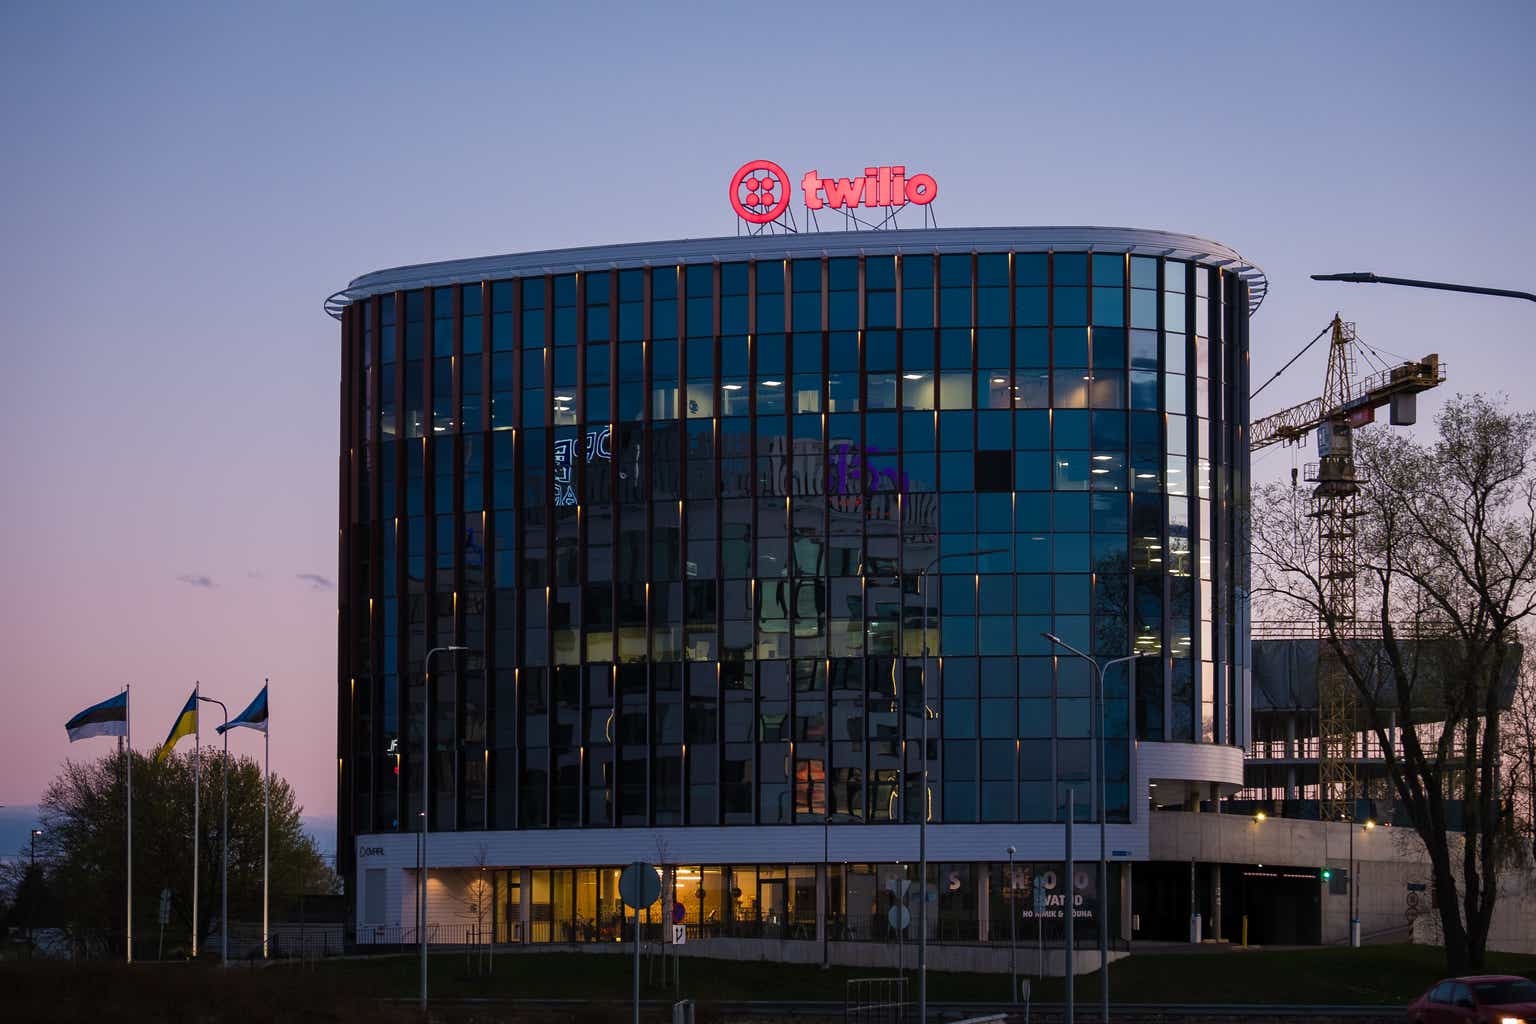
Twilio: Becoming A Free Cash Flow Behemoth
Twilio is achieving consistent, accelerating organic growth performance, driven by AI-related messaging tailwinds. Read why TWLO stock is a Buy.

Why Are Twilio (TWLO) Shares Soaring Today
Shares of customer engagement platform Twilio (NYSE:TWLO) jumped 26% in the afternoon session after the company reported second-quarter results that far exceeded analyst expectations and provided a strong outlook for the upcoming quarter.
Twilio to Participate in Upcoming Investor Events
SAN FRANCISCO, August 10, 2026--Twilio (NYSE: TWLO), the infrastructure for customer engagement in the AI era, today announced that it will participate in the following investor events:
Twilio Vaults 25% On Earnings, Hits Highs; Two More Stocks On Watch
Twilio stock is at levels last seen in January 2022. Twilio, Acadian Asset Manager and Ternium are showing relative strength at new highs.
Zacks Investment Ideas feature highlights: Twilio
Twilio's Q2 beat, raised outlook and strong cash flow sent shares soaring 30%, but its richer valuation raises questions.