
ENI SPA-SPONSORED ADR
ENYSETrading Snapshot
- Day Range
- $58.85 – $60.04
- 52-Week Range
- $36.13 – $62.16
- Volume (shares)
- 283,682
- Avg Volume (shares)
- —
- Shares Outstanding
- 1.49B
- Next Earnings
- 2027-02-24
Fundamentals Snapshot
- Annual Revenue
- $82.15B
- Last Q Revenue
- $22.67B
- P/E Ratio
- 10.1
- P/S Ratio
- 0.9x
- EPS (TTM)
- $5.32
- Dividend Yield
- 4.01%
- Dilution (1yr)
- −4.4%
ENI SPA-SPONSORED ADR
E StockOtter · stockotter.space
About ENI SPA-SPONSORED ADR
Eni S.p.A. is an international energy company primarily engaged in the discovery, development, and extraction of crude oil and natural gas resources. Its operations are organized into distinct divisions: Exploration & Production; Global Gas & LNG Portfolio; Refining & Marketing and Chemicals; Plenitude and Power; and Corporate and Other activities. The Exploration & Production division is responsible for the research, development, and output of oil, condensates, and natural gas, additionally undertaking initiatives in forestry conservation and carbon dioxide capture and storage. Its Global Gas & LNG Portfolio division oversees the procurement and wholesale distribution of natural gas via pipelines, including international transport, along with the acquisition and sale of liquefied natural gas (LNG). The Refining & Marketing and Chemicals segment manages the processing, supply, distribution, and commercialization of various fuels and chemical products. The Plenitude and Power segment, formerly known as Eni gas e luce, handles the retail provision of gas and electricity, alongside related services, and is involved in generating and wholesaling electricity from both thermoelectric and renewable power facilities. As of December 31, 2021, the company declared net proved reserves totaling 6,628 million barrels of oil equivalent and possessed an operational capacity of 4.5 gigawatts (GW). Established in 1953, Eni's corporate headquarters are situated in Rome, Italy.
Otter Score Breakdown
How it's scoredFive components, each rated 1–5★ and equally weighted (20%), averaged to a 0–100 score:💎 Quality — gross margin🚀 Growth — revenue YoY⚖️ Valuation — P/S ratio⚡ Momentum — 30-day price change💧 Dilution — 1-yr share issuance (buybacks score higher)Insufficient data for all five components.
Latest News & Updates

Cyprus Gas Development Gains Momentum: 3 Stocks to Watch
Cyprus' Cronos gas project enters execution, bringing E and TTE closer to LNG production, while CVX's Aphrodite project advances toward development.

Best Momentum Stocks to Buy for October 28th
AFRM, OVV and E made it to the Zacks Rank #1 (Strong Buy) momentum stocks list on October 28th, 2026.
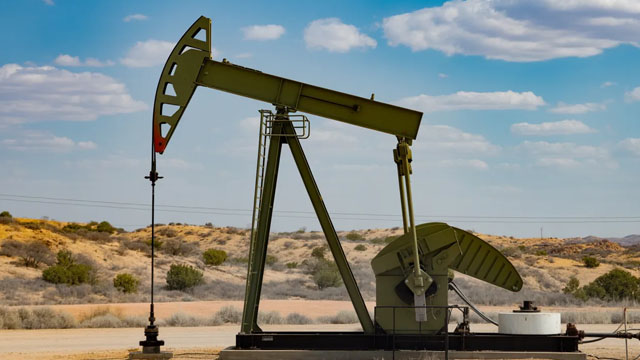
Should Value Investors Buy Eni (E) Stock?
Here at Zacks, our focus is on the proven Zacks Rank system, which emphasizes earnings estimates and estimate revisions to find great stocks. Nevertheless, we are always paying attention to the latest value, growth, and

New Strong Buy Stocks for October 28th
AFRM, WDC, OVV, E and DEO have been added to the Zacks Rank #1 (Strong Buy) List on October 28th, 2026.

Best Growth Stocks to Buy for October 28th
E, FIVE and OSCR made it to the Zacks Rank #1 (Strong Buy) growth stocks list on October 28th, 2026.

Best Value Stocks to Buy for October 28th
DEO, E and OVV made it to the Zacks Rank #1 (Strong Buy) value stocks list on October 28th, 2026.