

CHUBB LTD
CBNYSETrading Snapshot
- Day Range
- $575.57 – $587.80
- 52-Week Range
- $265.30 – $365.91
- Volume
- $6.92B
- Avg Volume
- $8.07B
- Shares Outstanding
- 385.8M
- Next Earnings
- Sep 8, 2026
Fundamentals Snapshot
- Annual Revenue
- $62.10B
- Last Q Revenue
- $15.83B
- P/E Ratio
- 12.0
- P/S Ratio
- 2.2x
- EPS (TTM)
- $28.26
- Dividend Yield
- 1.15%
Why Investors Own CB
- ✓High-growth profile — revenue up -8.4% YoY with expanding US Equity exposure.
- ✓Healthy economics — 35% gross margin and 20% free-cash-flow margin.
- ✓New products and segments could unlock additional revenue streams.
Execution delays, intensifying competition, and valuation compression if growth decelerates.
Financial Trends
About CHUBB LTD
A company profile for CHUBB LTD isn’t available yet — check back soon.
Otter Score Breakdown
ⓘAnalyst Ratings
ⓘLatest News & Updates

Congresswoman Bets on Berkshire's Post-Buffett Future, Buys Shares Before Q2 Earnings
A member of Congress bought Berkshire Hathaway shares right before Q2 earnings and the stock hitting new 52-week highs.

Berkshire Hathaway Stock Nears Record. Wall Street Liked Its Earnings Report.
Berkshire Hathaway stock could have even more upside. Investors have been reacting favorably to some key aspects of the company’s second-quarter earnings report.

Recent Filing Shows That Rep. Maria Elvira Salazar Bought Over $46K Worth of Berkshire Hathaway Inc. New Common Stock Stock
An official report on August 7, 2026 reveals Representative Maria Elvira Salazar's recent purchase of Berkshire Hathaway Inc. New Common Stock (NYSE:BRK) stock, valued between $46,004 and $165,000. The transaction
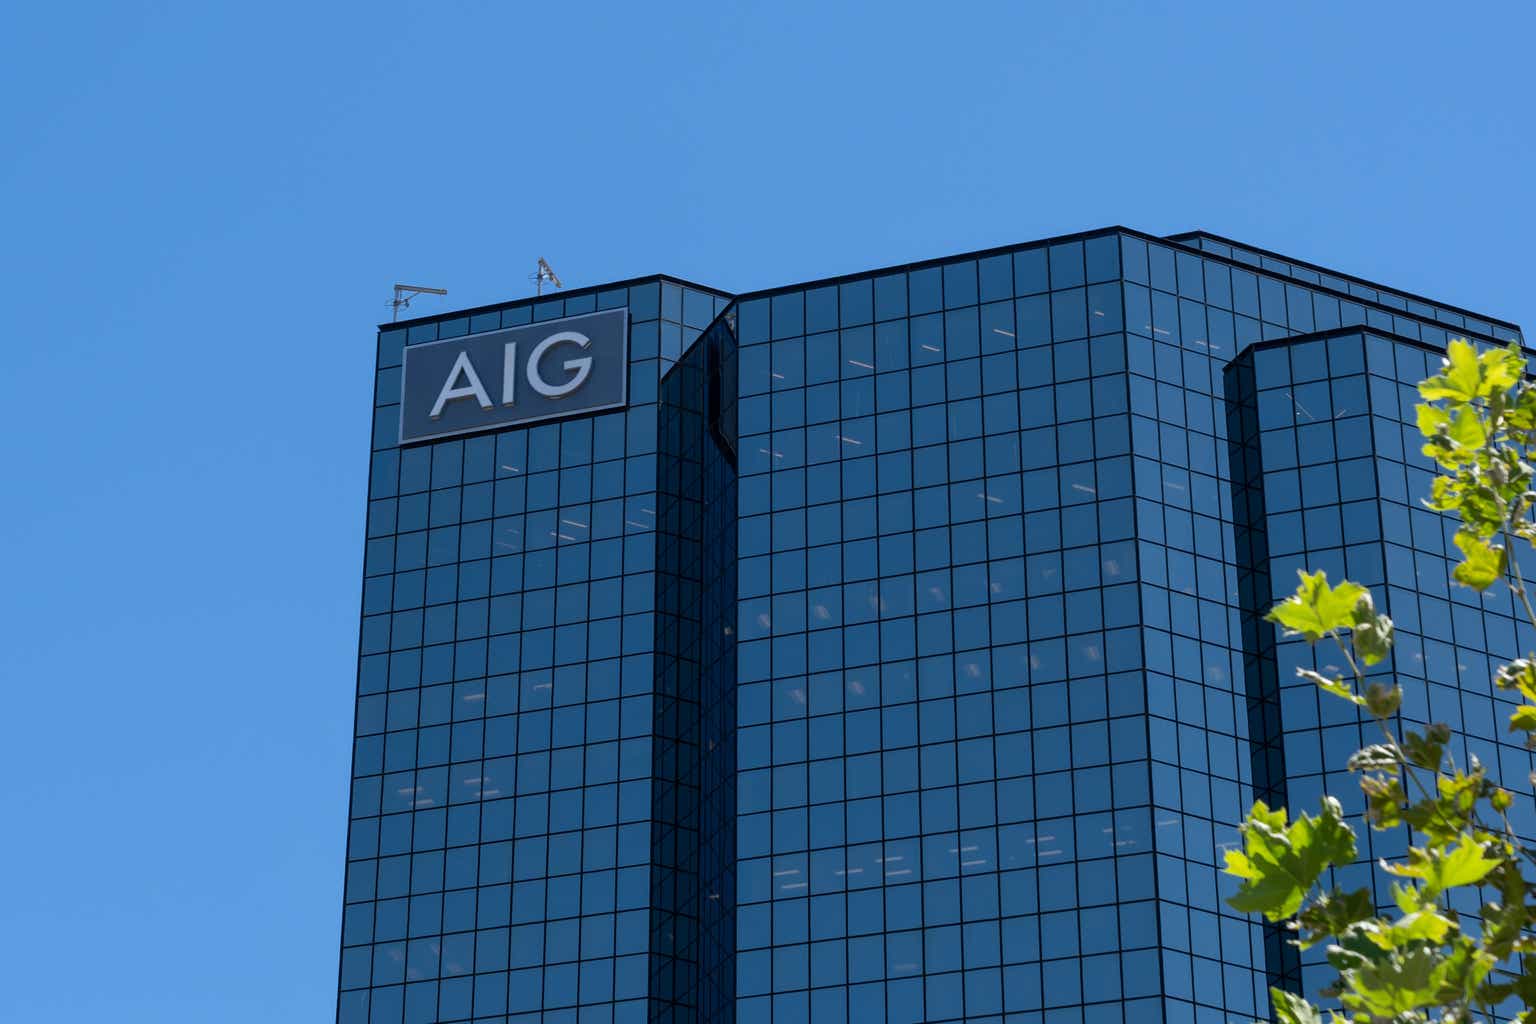
AIG: Execution Is The Key
AIG Q2 shows disciplined underwriting, 10% adj EPS growth and rising premiumsâyet catalysts are limited.
Berkshire Earnings Were Good—Not Great. A Real Bright Spot Was This.
A highlight was the repurchase of $4.5 billion of shares in the second quarter. The figure was just $235 million in the first quarter

Chubb, Toast And A Health Care Stock On CNBC’s ‘Final Trades’
Bill Baruch chose Amgen Inc. as his final trade, citing its strong Q2 results and raised guidance. Malcolm Ethridge recommended Chubb.