

BROADCOM INC
AVGONASDAQTrading Snapshot
- Day Range
- $412.29 – $418.05
- 52-Week Range
- $281.87 – $495.00
- Volume
- $14.09B
- Avg Volume
- $12.15B
- Shares Outstanding
- 4.76B
- Next Earnings
- Oct 11, 2026
Fundamentals Snapshot
- Annual Revenue
- $76.36B
- Last Q Revenue
- $17.84B
- P/E Ratio
- 68.6
- P/S Ratio
- 26.6x
- EPS (TTM)
- $6.01
- Dividend Yield
- 0.58%
Why Investors Own AVGO
- ✓High-growth profile — revenue up +4.8% YoY with expanding AI Infrastructure exposure.
- ✓Healthy economics — 76% gross margin and 14% free-cash-flow margin.
- ✓Riding accelerating AI capex from hyperscalers and enterprises.
Execution delays, intensifying competition, and valuation compression if growth decelerates.
Financial Trends
About BROADCOM INC
Semiconductor and infrastructure software.
Otter Score Breakdown
ⓘAnalyst Ratings
ⓘLatest News & Updates
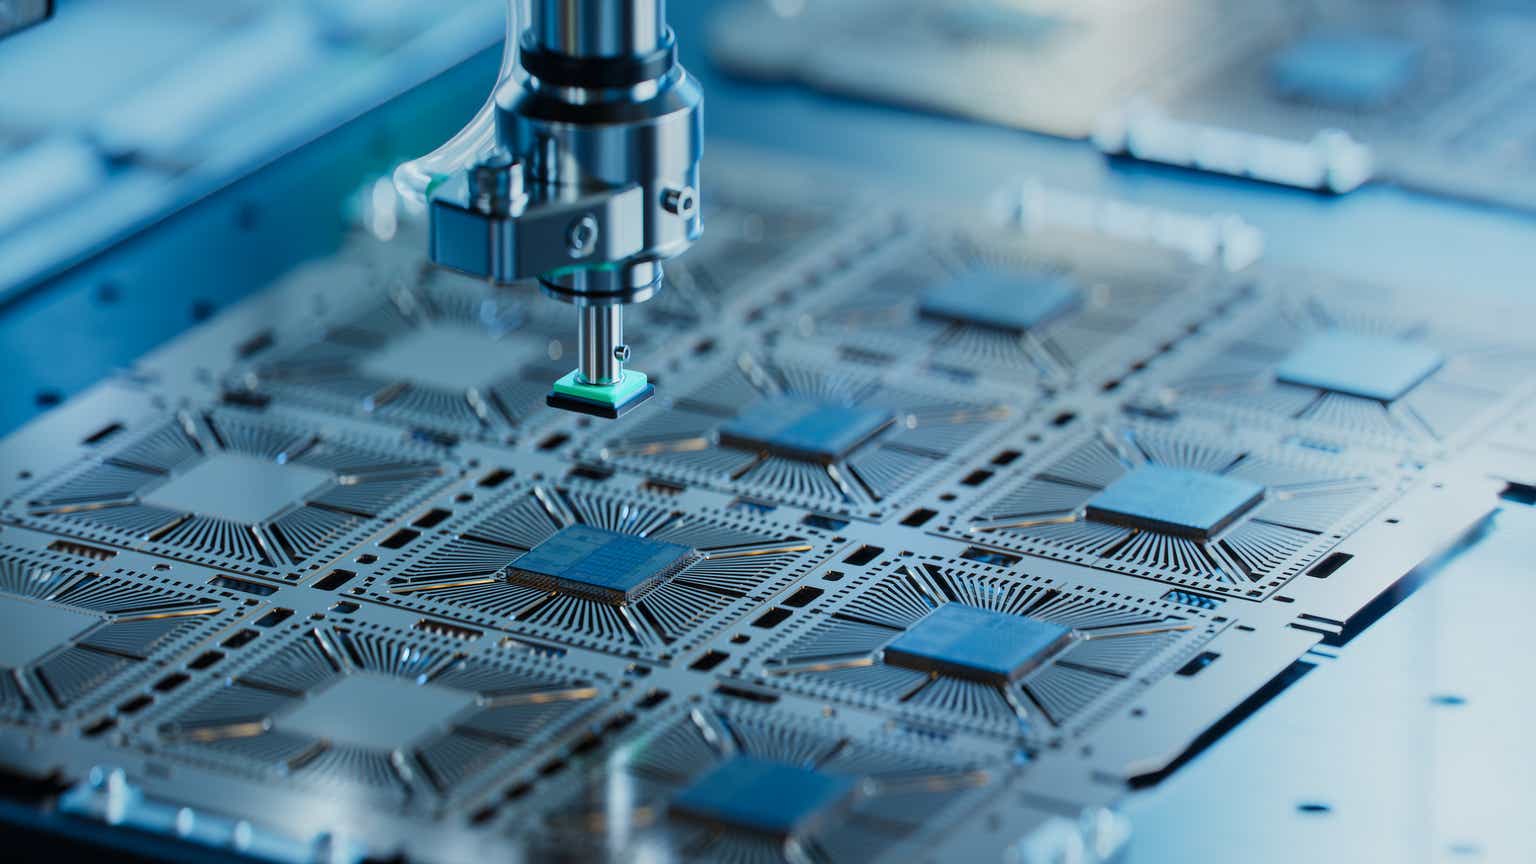
Where The Next $1.3 Trillion Of CapEx Gets Spent
Semiconductor sector faces capex-fatigue, but committed $1.3T cloud spending through 2027 underpins long-term opportunity. Read the full analysis here.

FTEC: Fidelity's IT ETF Is A Fantastic Long-Term Core Tech Holding
Fidelity MSCI Information Technology ETF has delivered exceptional long-term outperformance. Click to know why FTEC is a good long-term tech holding.

Navigating AI Waves: How Capital Rotation Will Propel SPY And QQQ
Buy SPY and QQQ on dips as AI investing rotates from chipmakers to Big Tech and CapEx cools. Click for an updated market outlook.

Nvidia's Chip Boom Is Spreading: JPMorgan Says These 6 Stocks Could Ride It
JPMorgan predicts a $2.25 trillion global semiconductor industry by 2027, with growth now spreading beyond memory chips and AI to other categories.
Netskope: Not Compelling Yet
Nvidia: Not Cheap Enough, Yet
Nvidia Corporation outlook: rising volatility, limited upside, AI capex & financing risks, China uncertainty and ASIC competition. Click for this NVDA update.